Série 3
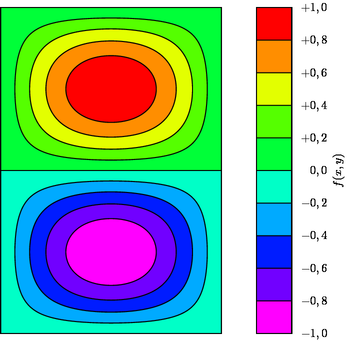
Figure fillcontour.asy
import graph;
import palette;
import contour;

size(12cm,IgnoreAspect);

pair a=(pi/2,0);
pair b=(1.5*pi+epsilon,2pi);

real f(real x, real y) {return cos(x)*sin(y);}

int N=100;
int Divs=10;

defaultpen(1bp);

bounds range=bounds(-1,1);

real[] Cvals=uniform(range.min,range.max,Divs);
guide[][] g=contour(f,a,b,Cvals,N,operator --);

pen[] Palette=quantize(Rainbow(),Divs);

pen[][] interior=interior(g,extend(Palette,grey,black));
fill(g,interior);
draw(g);

palette("$f(x,y)$",range,point(SE)+(0.5,0),point(NE)+(1,0),Right,Palette,
        PaletteTicks("$%+#0.1f$",N=Divs));
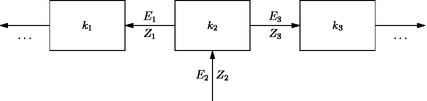
Figure fjortoft.asy
size(15cm,0);

pair d=(1.5,1);
real s=d.x+1;

picture box(string s) {
  picture pic;
  draw(pic,box(0,d));
  label(pic,s,d/2);
  return pic;
}

add(box("$k_1$"));
add(shift(s)*box("$k_2$"));
add(shift(s)^2*box("$k_3$"));

path g=(d.x,d.y/2)--(s,d.y/2);
path G=(d.x/2,-(s-d.x))--(d.x/2,0);

draw(Label(baseline("$\ldots$")),shift(-s)*g,BeginArrow,BeginPenMargin);
draw(Label("$Z_1$"),g,BeginArrow,BeginPenMargin);
draw(Label("$E_1$",LeftSide),g,Blank);
draw(Label("$Z_3$"),shift(s)*g,Arrow,PenMargin);
draw(Label("$E_3$",LeftSide),shift(s)*g,Blank);
draw(Label("$Z_2$"),shift(s)*G,Arrow,PenMargin);
draw(Label("$E_2$",LeftSide),shift(s)*G,Blank);
draw(Label(baseline("$\ldots$")),shift(s)^2*g,Arrow,PenMargin);
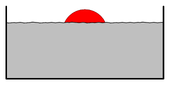
Figure floatingdisk.asy
import trembling;
//settings.outformat="pdf";
size(6cm,0);

real R=1/5;
real h=0.5;
real d=1/12;
real l=.7;

pair pA=(-l,0);
pair pB=(l,0);

path waterline=tremble(addnodes(pA..pB,1),angle=10,frequency=0.1,random=50);
path disk=shift(0,-d)*(scale(R)*unitcircle);
path water=waterline--(l,-h)--(-l,-h)--(-l,0)--cycle;
path container=(l,1/7)--(l,-h)--(-l,-h)--(-l,1/7);

filldraw(disk,red,linewidth(.3));
fill(water,mediumgrey+opacity(0.5));
draw(waterline);

draw(container,linewidth(1.5));

shipout(bbox(2mm,Fill(white)));
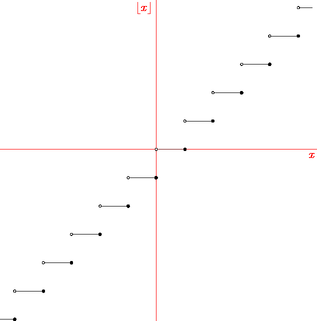
Figure floor.asy
import graph;
unitsize(1cm);

real Floor(real x) {return floor(x);}

pair[] Close;
pair[] Open;

bool3 branch(real x) {
  static real lasty;
  static bool first=true;
  real y=floor(x);
  bool samebranch=first || lasty == y;
  first=false;
  if(samebranch) lasty=x;
  else {
    Close.push((x,lasty));
    Open.push((x,y));
  }
  lasty=y;
  return samebranch ? true : default;
};

draw(graph(Floor,-5.5,5.5,500,branch));
axes("$x$",rotate(0)*"$\lfloor x\rfloor$",red);

dot(Close);
dot(Open,UnFill);
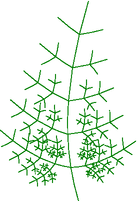
Figure fractaltree.asy
size(200);

path ltrans(path p,int d)
{
  path a=rotate(65)*scale(0.4)*p;
  return shift(point(p,(1/d)*length(p))-point(a,0))*a;
}
path rtrans(path p, int d)
{
  path a=reflect(point(p,0),point(p,length(p)))*rotate(65)*scale(0.35)*p;
  return shift(point(p,(1/d)*length(p))-point(a,0))*a;
}

void drawtree(int depth, path branch)
{
  if(depth == 0) return;
  real breakp=(1/depth)*length(branch);
  draw(subpath(branch,0,breakp),deepgreen);
  drawtree(depth-1,subpath(branch,breakp,length(branch)));
  drawtree(depth-1,ltrans(branch,depth));
  drawtree(depth-1,rtrans(branch,depth));
  return;
}

path start=(0,0)..controls (-1/10,1/3) and (-1/20,2/3)..(1/20,1);
drawtree(6,start);
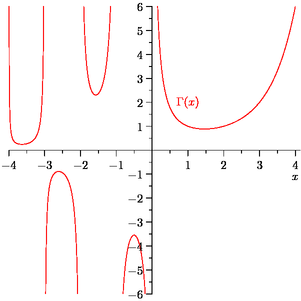
Figure gamma.asy
import graph;
size(300,IgnoreAspect);

bool3 branch(real x)
{
  static int lastsign=0;
  if(x <= 0 && x == floor(x)) return false;
  int sign=sgn(gamma(x));
  bool b=lastsign == 0 || sign == lastsign;
  lastsign=sign;
  return b ? true : default;
}

draw(graph(gamma,-4,4,n=2000,branch),red);

scale(false);
xlimits(-4,4);
ylimits(-6,6);
crop();

xaxis("$x$",RightTicks(NoZero));
yaxis(LeftTicks(NoZero));

label("$\Gamma(x)$",(1,2),red);
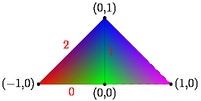
Figure Gouraud.asy
size(200);

pen[] p={red,green,blue,magenta};
pair[] z={(-1,0),(0,0),(0,1),(1,0)};
int[] edges={0,0,0,1};
gouraudshade(z[0]--z[2]--z[3]--cycle,p,z,edges);

draw(z[0]--z[1]--z[2]--cycle);
draw(z[1]--z[3]--z[2],dashed);

dot(Label,z[0],W);
dot(Label,z[1],S);
dot(Label,z[2],N);
dot(Label,z[3],E);

label("0",z[0]--z[1],S,red);
label("1",z[1]--z[2],E,red);
label("2",z[2]--z[0],NW,red);
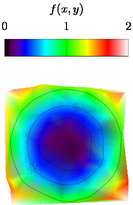
Figure Gouraudcontour.asy
import graph;
import palette;
import contour;

size(200);

int n=100;

real[] x=new real[n];
real[] y=new real[n];
real[] f=new real[n];

real F(real a, real b) {return a^2+b^2;}

real r() {return 1.1*(rand()/randMax*2-1);}

for(int i=0; i < n; ++i) {
  x[i]=r();
  y[i]=r();
  f[i]=F(x[i],y[i]);
}

pen Tickpen=black;
pen tickpen=gray+0.5*linewidth(currentpen);
pen[] Palette=BWRainbow();

bounds range=image(x,y,f,Range(0,2),Palette);
draw(contour(pairs(x,y),f,new real[]{0.25,0.5,1},operator ..));

palette("$f(x,y)$",range,point(NW)+(0,0.5),point(NE)+(0,0.8),Top,Palette,
        PaletteTicks(Tickpen,tickpen));
Figure grid.asy
import math;
size(100,0);

add(shift(-5,-5)*grid(10,10));

dot((0,0),red);
Figure hierarchy.asy
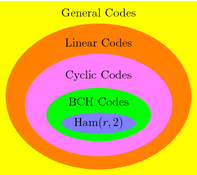
texpreamble("\def\Ham{\mathop {\rm Ham}\nolimits}");
pair align=2N;
frame f;
ellipse(f,Label("$\Ham(r,2)$",(0,0)),lightblue,Fill,above=false);
ellipse(f,Label("BCH Codes",point(f,N),align),green,Fill,above=false);
ellipse(f,Label("Cyclic Codes",point(f,N),align),lightmagenta,Fill,above=false);
ellipse(f,Label("Linear Codes",point(f,N),align),-4mm,orange,Fill,above=false);
box(f,Label("General Codes",point(f,N),align),2mm,yellow,Fill,above=false);
add(f);
Figure hyperboloid.asy
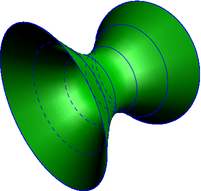
size(200);
import solids;
settings.render=0;
settings.prc=false;


currentprojection=perspective(4,4,3);
revolution hyperboloid=revolution(new real(real x) {return sqrt(1+x*x);},
                                  -2,2,20,operator..,X);
draw(surface(hyperboloid),green);
draw(hyperboloid,6,blue,longitudinalpen=nullpen);
Figure hyperboloidsilhouette.asy
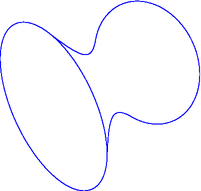
size(200);
import solids;
settings.render=0;
settings.prc=false;

currentprojection=perspective(4,4,3);
revolution hyperboloid=revolution(new real(real x) {return sqrt(1+x*x);},
                                  -2,2,20,operator..,X);
draw(hyperboloid.silhouette(64),blue);
Figure imagehistogram.asy
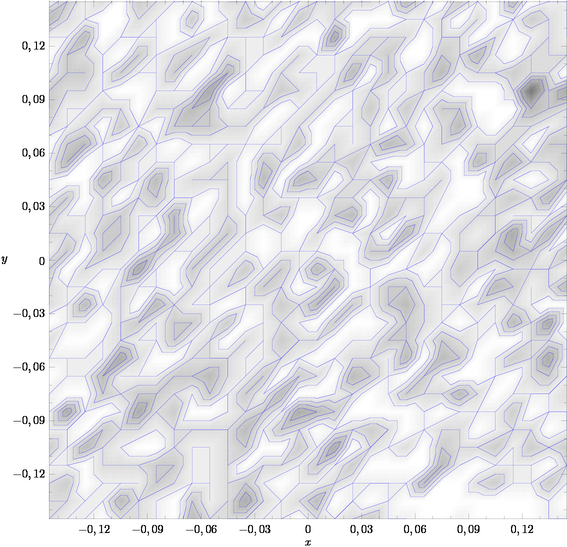
import stats;
import graph;
import palette;
import contour;

size(20cm);

scale(false);

pair[] data=new pair[50000];
for(int i=0; i < data.length; ++i)
  data[i]=Gaussrandpair();

// Histogram limits and number of bins
pair datamin=(-0.15,-0.15);
pair datamax=(0.15,0.15);
int Nx=30;
int Ny=30;

int[][] bins=frequency(data,datamin,datamax,Nx,Ny);

real[] values=new real[Nx*Ny];
pair[] points=new pair[Nx*Ny];
int k=0;
real dx=(datamax.x-datamin.x)/Nx;
real dy=(datamax.y-datamin.y)/Ny;
for(int i=0; i < Nx; ++i) {
  for(int j=0; j < Ny; ++j) {
    values[k]=bins[i][j];
    points[k]=(datamin.x+(i+0.5)*dx,datamin.y+(j+0.5)*dy);
    ++k;
  }
}

// Create a color palette
pen[] InvGrayscale(int NColors=256) {
  real ninv=1.0/(NColors-1.0);
  return sequence(new pen(int i) {return gray(1-17*i*ninv);},NColors);
}

// Draw the histogram, with axes
bounds range=image(points,values,Range(0,40),InvGrayscale());
draw(contour(points,values,new real[] {1,2,3,4,8,12,16,20,24,28,32,36,40},
             operator--),blue);
xaxis("$x$",BottomTop,LeftTicks,above=true);
yaxis("$y$",LeftRight,RightTicks,above=true);