Série 2
Figure controlsystem.asy

size(0,4cm);
import flowchart;

block delay=roundrectangle("$e^{-sT_t}$",(0.33,0));
block system=roundrectangle("$\frac{s+3}{s^2+0.3s+1}$",(0.6,0));
block controller=roundrectangle("$0.06\left( 1 + \frac{1}{s}\right)$",
				(0.45,-0.25));
block sum1=circle("",(0.15,0),mindiameter=0.3cm);
block junction1=circle("",(0.75,0),fillpen=currentpen);

draw(delay);
draw(system);
draw(controller);
draw(sum1);
draw(junction1);

add(new void(picture pic, transform t) {
    draw(pic,Label("$u$",0.5,N),path(new pair[]{t*(0,0),sum1.left(t)},
				     Horizontal),Arrow,PenMargin);

    draw(pic,path(new pair[]{sum1.right(t),delay.left(t)},Horizontal),Arrow,
	 PenMargin);
    label(pic,"-",sum1.bottom(t),ESE);

    draw(pic,path(new pair[]{delay.right(t),system.left(t)},Horizontal),Arrow,
	 PenMargin);

    draw(pic,path(new pair[]{system.right(t),junction1.left(t)},Horizontal),
	 PenMargin);

    draw(pic,Label("$y$",0.5,N),path(new pair[]{junction1.right(t),t*(0.9,0)},
				   Horizontal),Arrow,PenMargin);

    draw(pic,path(new pair[]{junction1.bottom(t),controller.right(t)},Vertical),
	 Arrow,PenMargin);

    draw(pic,path(new pair[]{controller.left(t),sum1.bottom(t)},Horizontal),
	 Arrow,PenMargin);
  });
Figure cos2theta.asy

import graph;
size(0,100);

real f(real t) {return cos(2*t);}

path g=polargraph(f,0,2pi,operator ..)--cycle;
fill(g,green+white);
xaxis("$x$",above=true);
yaxis("$y$",above=true);
draw(g);

dot(Label,(1,0),NE);
dot(Label,(0,1),NE);
Figure cosaddition.asy

size(0,200);
import geometry;

real A=130;
real B=40;

pair O=(0,0);
pair R=(1,0);
pair P=dir(A);
pair Q=dir(B);

draw(circle(O,1.0));
draw(Q--O--P);
draw(P--Q,red);
draw(O--Q--R--cycle);

draw("$A$",arc(R,O,P,0.3),blue,Arrow,PenMargin);
draw("$B$",arc(R,O,Q,0.6),blue,Arrow,PenMargin);
pair S=(Cos(B),0);
draw(Q--S,blue);
perpendicular(S,NE,blue);

dot(O);
dot("$R=(1,0)$",R);
dot("$P=(\cos A,\sin A)$",P,dir(O--P)+W);
dot("$Q=(\cos B,\sin B)$",Q,dir(O--Q));
Figure curvedlabel.asy

size(200);
import labelpath;
labelpath("This is a test of curved labels in Asymptote (implemented with the {\tt PSTricks pstextpath} macro).",reverse(rotate(-90)*unitcircle));
Figure delu.asy
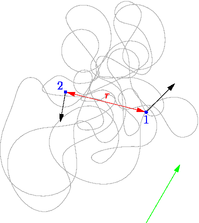
size(7cm,0);

pair z1=(1,-0.25);
pair v1=dir(45);
pair z2=-z1;
pair v2=0.75*dir(260);
pair z3=(z1.x,-3);

// A centered random number
real crand() {return unitrand()-0.5;}

guide g;
pair lastz;
for(int i=0; i < 60; ++i) {
  pair z=0.75*lastz+(crand(),crand());
  g=g..2.5*z;
  lastz=z;
}
g=shift(0,-.5)*g..cycle;

draw(g,gray(0.7));

draw("$r$",z1--z2,RightSide,red,Arrows,DotMargins);
draw(z1--z1+v1,Arrow);
draw(z2--z2+v2,Arrow);
draw(z3--z3+v1-v2,green,Arrow);

dot("1",z1,S,blue);
dot("2",z2,NW,blue);
Figure dimension.asy

size(12cm,0);

void distance(picture pic=currentpicture, pair A, pair B, Label L="", real n=0,
              pen p=currentpen)
{
  real d=3mm;
  path g=A--B;
  transform T=shift(-n*d*unit(B-A)*I);
  pic.add(new void(frame f, transform t) {
      picture opic;
      path G=T*t*g;
      draw(opic,Label(L,Center,UnFill(1)),G,p,Arrows(NoFill),Bars,PenMargins);
      add(f,opic.fit());
    });
  pic.addBox(min(g),max(g),T*min(p),T*max(p));
}

pair A=(0,0), B=(3,3);

dot(A);
dot(B);

distance(A,B,"$\ell$",1);
Figure dragon.asy

pair crease(pair z1, pair z2, bool left)
{
  pair dz = z2 - z1;

  if (left)
    return z1 + dz * (0.5, 0.5);
  else
    return z1 + dz * (0.5, -0.5);
}

pair[] fold(pair[] oldz)
{
  int n = oldz.length;
  pair[] newz = new pair[2n-1];

  for (int i = 0; i < n-1; ++i)
    {
      newz[2i] = oldz[i];
      newz[2i+1] = crease(oldz[i], oldz[i+1], i%2==0);
    }

  newz[2(n-1)] = oldz[n-1];

  return newz;
}

pair[] dragon(int n, pair[] base={})
{
  if (base.length == 0)
    if (n%2 == 0)
      base = new pair[] {(0,0), (1,1) };
    else
      base = new pair[] {(0,0), (1,0) };

  pair[] z = base;

  for (int i = 1; i < n; ++i)
    z = fold(z);

  return z;
}

void drawtris(pair[] z, pen p = currentpen)
{
  int n = z.length;

  for (int i = 0; i < n-2; i+=2)
    fill(z[i]--z[i+1]--z[i+2]--cycle, p);
}

void drawtris(pair[] z, pen p1, pen p2)
{
  int n = z.length;

  for (int i = 0; i < n-2; i+=2)
    fill(z[i]--z[i+1]--z[i+2]--cycle, 2i < n-1 ? p1 : p2);
}

size(500,0);

int n = 10;

drawtris(dragon(n, new pair[] {(0,0), (1,0)}), black);
drawtris(dragon(n, new pair[] {(0,0), (0,-1)}), blue);
drawtris(dragon(n, new pair[] {(0,0), (-1,0)}), red);
drawtris(dragon(n, new pair[] {(0,0), (0,1)}),  green);
Figure electromagnetic.asy
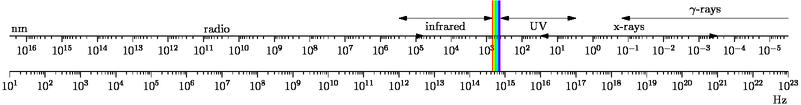
import graph;
import palette;
texpreamble("\usepackage[amssymb,thinqspace,thinspace]{SIunits}");

size(800,200);

real c=3e8;
real nm=1e-9;
real freq(real lambda) {return c/(lambda*nm);}
real lambda(real f) {return c/(f*nm);}

real fmin=10;
real fmax=1e23;

scale(Log(true),Linear(true));
xlimits(fmin,fmax);
ylimits(0,1);

real uv=freq(400);
real ir=freq(700);

bounds visible=bounds(Scale(uv).x,Scale(ir).x);
palette(visible,uv,ir+(0,2),Bottom,Rainbow(),invisible);

xaxis(Label("\hertz",1),Bottom,RightTicks,above=true);

real log10Left(real x) {return -log10(x);}
real pow10Left(real x) {return pow10(-x);}

scaleT LogLeft=scaleT(log10Left,pow10Left,logarithmic=true);

picture q=secondaryX(new void(picture p) {
    scale(p,LogLeft,Linear);
    xlimits(p,lambda(fmax),lambda(fmin));
    ylimits(p,0,1);
    xaxis(p,Label("\nano\metre",1),Top,LeftTicks(DefaultLogFormat,n=10));
  });

add(q,above=true);

margin margin=PenMargin(0,0);
draw("radio",Scale((10,1))--Scale((5e12,1)),N,Arrow);
draw("infrared",Scale((1e12,1.5))--Scale(shift(0,1.5)*ir),Arrows,margin);
draw("UV",Scale(shift(0,1.5)*uv)--Scale((1e17,1.5)),Arrows,margin);
draw("x-rays",Scale((1e16,1))--Scale((1e21,1)),N,Arrows);
draw("$\gamma$-rays",Scale((fmax,1.5))--Scale((2e18,1.5)),Arrow);
Figure equilateral.asy

size(10cm,0);
import math;

pair b=(0,0), c=(1,0);
pair a=extension(b,b+dir(60),c,c+dir(120));
pair d=extension(b,b+dir(30),a,a+dir(270));

draw(a--b--c--a--d--b^^d--c);
label("$A$",a,N);
label("$B$",b,W);
label("$C$",c,E);
label("$D$",d,S);
Figure fano.asy

import math;

size(100,0);

pair z4=(0,0);
pair z7=(2,0);
pair z1=point(rotate(60)*(z4--z7),1);

pair z5=interp(z4,z7,0.5);
pair z3=interp(z7,z1,0.5);
pair z2=interp(z1,z4,0.5);
pair z6=extension(z4,z3,z7,z2);

draw(z4--z7--z1--cycle);
draw(z4--z3);
draw(z7--z2);
draw(z1--z5);
draw(circle(z6,abs(z3-z6)));

label("1",z1,dir(z5--z1));
label("2",z2,dir(z7--z2));
label("3",z3,dir(z4--z3));
label("4",z4,dir(z3--z4));
label("5",z5,dir(z1--z5));
label("6",z6,2.5E+0.1*N);
label("7",z7,dir(z2--z7));
Figure fermi.asy

import feynman;

// set default line width to 0.8bp
currentpen = linewidth(0.8);

// scale all other defaults of the feynman module appropriately
fmdefaults();

// disable middle arrows
currentarrow = None;

// define vertex and external points

pair xu = (-40,+45);
pair xl = (-40,-45);
pair yu = (+40,+45);
pair yl = (+40,-45);

pair zu = (  0,+ 5);
pair zl = (  0,- 5);

// define mid points

pair mxu = (xu+zu)/2;
pair mxl = (xl+zl)/2;
pair myu = (yu+zu)/2;
pair myl = (yl+zl)/2;

// draw fermion lines
drawFermion(xu--zu--yu);
drawFermion(xl--zl--yl);

// draw vertices
drawVertexOX(zu);
drawVertexOX(zl);

// draw gluon. Note that the underlying fermion line is blotted out.
drawGluon(arc((0,0),mxu,myl,CW));

// shipout